In this article, let’s take a risk-oriented examination of the asset classes available to the everyday, retail investor. The goal is to provide a reasonably comprehensive overview of the different investment options available to the typical investor, along with the risks associated with each investment option.
For example, you may think that your current net worth precludes you from investing in fancy asset classes, such venture capital. “Angel investing and technology startups? That’s for high brow folks unlike myself!” However, with the advent of new technology and recent legislative changes, there are now many channels for folks from varying backgrounds to invest not only in things like seed-level venture capital, but other areas such as commercial real estate and private loans, all with a laptop from the comfort of your own home.
Without further ado, here’s the Table of Asset Classes. It is meant to be ordered in general level of risk, from the least risky to the most risky of investments. Of course, there are always exceptions, nuances, and differences of risk within and across neighboring asset classes on the risk spectrum. The hope is that the reader can use this guideline as a starting point, but still maintain due diligence and do the required homework before diving into unfamiliar investment areas.
| Asset Class | Types | Risk |
|---|---|---|
| Cash |
|
Low |
| Bonds (Debt) |
|
Low |
| Stocks (Equities) |
|
Medium |
| Real Estate |
|
Medium |
| Commodities |
|
High |
| Currencies |
|
High |
| Private equity |
|
Very High |
| Speculative |
|
Very High |
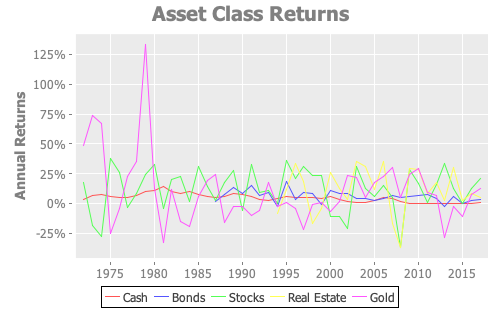
Additionally, it’s useful to visualize historical measures of risk for some of the aforementioned asset classes. Here, we examine 45 years of historical annual Asset Class Returns dataset provided by Portfolio Visualizer, dating back to 1972. To start, let’s look at the annual returns across broad asset classes:

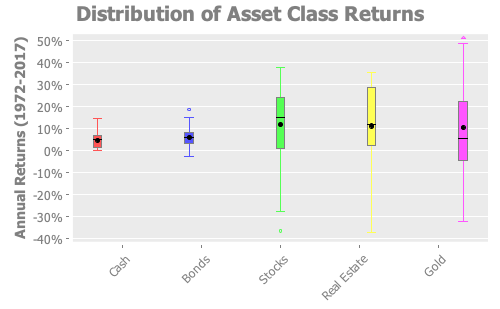
We can see that the performance of some asset classes have bigger fluctuations than other asset classes. That is, in fact, a visual representation of risk - the likelihood of an asset class to have wild swings in returns. Rather than look at a relatively noisy graph of returns over time, we can compare the distribution of returns for each asset class across all time periods in our dataset. In this case, a box plot does a decent job of letting us compare the “spread” of annual returns for each asset class:

From the box plot, we can see that asset classes like cash or bonds tend to have small spreads in their distributions, where the returns are likely to fluctuate less but the potential upside is limited. On the other end of the spectrum, an asset class like gold has the potential to occasionally exhibit extreme returns, but in both positive and negative directions.
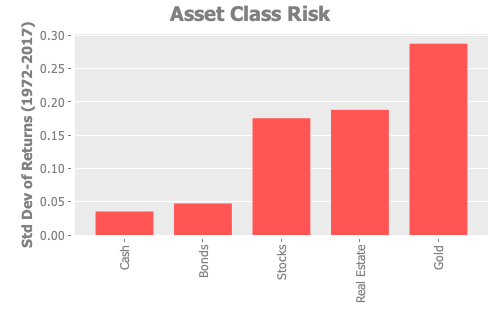
Finally, we can compute a single, statistical measure of risk for each asset class by taking the standard deviation of annual returns across all time periods. For the common asset classes for which we have historical data, the statistical measure more or less reflects the conventional wisdom as depicted in our Table of Asset Classes above.

My view is that taking a risk-oriented view of broad asset classes can serve as a healthy reminder for investors to think critically about the type of investments they make. Before you plop down a hefty sum of cash for that fancy cryptocurrency exchange-traded fund, take a second to think where that investment type falls in the risk spectrum.
Comments